Indicator
Acquiring a food processor doesn’t make one a chef, just as purchasing a sword doesn’t make one a ninja.
Similarly, an indicator is only a tool. It is effective as long as you apply other aspects of trading strategy correctly.
But having access to a good tool that just works can make life very simple.
The goal here is for you to have an All-in-One indicator that you can rely on for
- Real-time for LTF trading,
- Scaling in and out of model positions,
- Using it on assets not actively covered in Web3Quant updates.
NOT claiming this as the best indicator out there, If you have a working system that works better for you then just stick to that.
This is designed to be Simple & objective which can be used in confluence with the Web3Quant model updates.
As always even before the HOW (solution), let's do the WHAT (problem) first.
Problem#1 Overcrowding
Too many indicators are like a person who talks a lot but doesn't say anything. All they do is add noise.
Solution: Web3Quant is an "All in one" Indicator that tells you exactly when to long/short with support/resistance levels. It will help one make decisions instantly without any subjective analysis.
Problem#2 Over-fitting
If too many indicators weren't enough, most need to work on different settings/values to make it work on different assets. Like what would work for BTC might not work on Gold or Bonds.
Also when you find an indicator, there's this itch to keep changing values and tinkering and going back and forth. Been there, Done that.
This usually results in analysis paralysis as you never can settle on a single working system.
Solution: Web3Quant indicator is universal and comes with all settings preconfigured.
It's been tested on 100s of assets across multiple timeframes. from Crypto to Stocks to bonds to Forex to Commodities.
Problem#3 Optimize for Lag or Smoothness?
No indicator will have a 100% hit rate. As a dev, you need to prioritize if you want cleaner signals or more responsive signals.
For example: If you plot a Buy/Sell signal based on a 200 moving average you will get fewer cleaner signals but it comes with a significant lag.
50ma will be responsive but you will get a lot of fake signals and most gains would be chopped in a sideways market.
Market trends 30% of the time and ranges for 70%. That's why most indicators do not work on their own.
What trade-off you choose to accept depends a lot on your style and strategy.
Solution - Web3Quant indicator is optimized to be balanced with a high signal-to-noise ratio.
Problem#4 Doesn't work in All conditions
There are many trading styles but the majority can be slotted into 2 categories.
Trend/Breakout and Mean Reversion.
When the markets are ranging/sideways your trend indicators don't work and when they are trending hard mean reversion ones fail.
Solution: All assets are tested since their inception factoring wide range of conditions. You can check all the results and make an assessment.
What makes an indicator useful?
- It needs to be able to give definitive - Buy & Sell as early as possible.
Otherwise, you only get ambiguity and noise. Not Signal. - The signal needs to be clean without flips/flops. which allows you to stay in the trade for as long as possible to ride the full move
Otherwise, Whipsaws/sideways markets will kill most gains. - Should be universal (in both, settings and asset coverage).
Otherwise, it will never be practical unless you are a single-asset trader. - Should work on a consistent time frame which can be set as HTF/LTF.
Otherwise, you will forever be in analysis paralysis mode for every new asset.
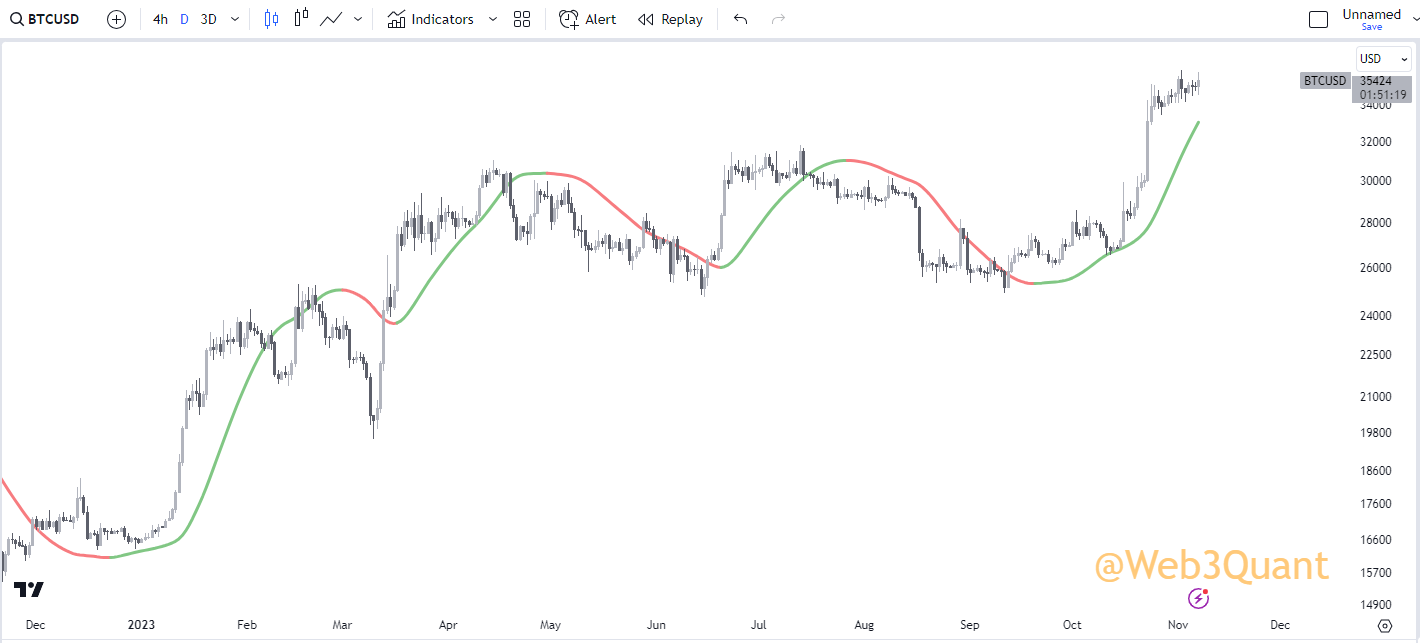
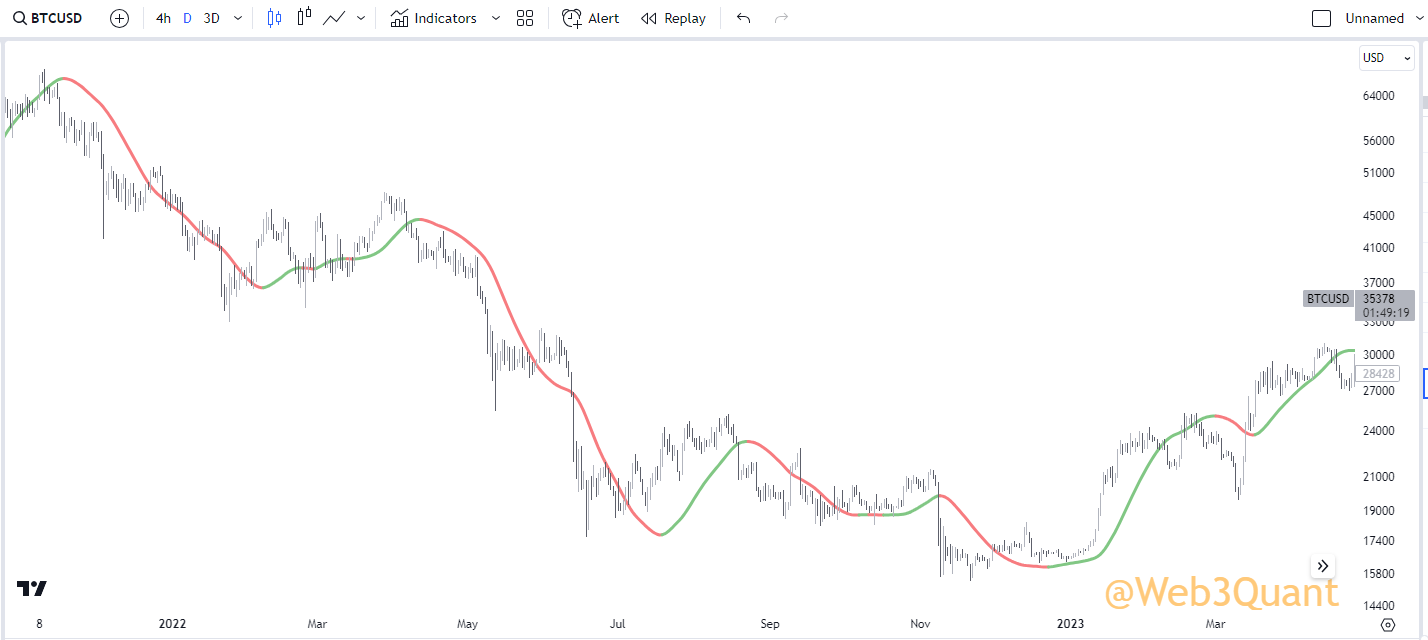
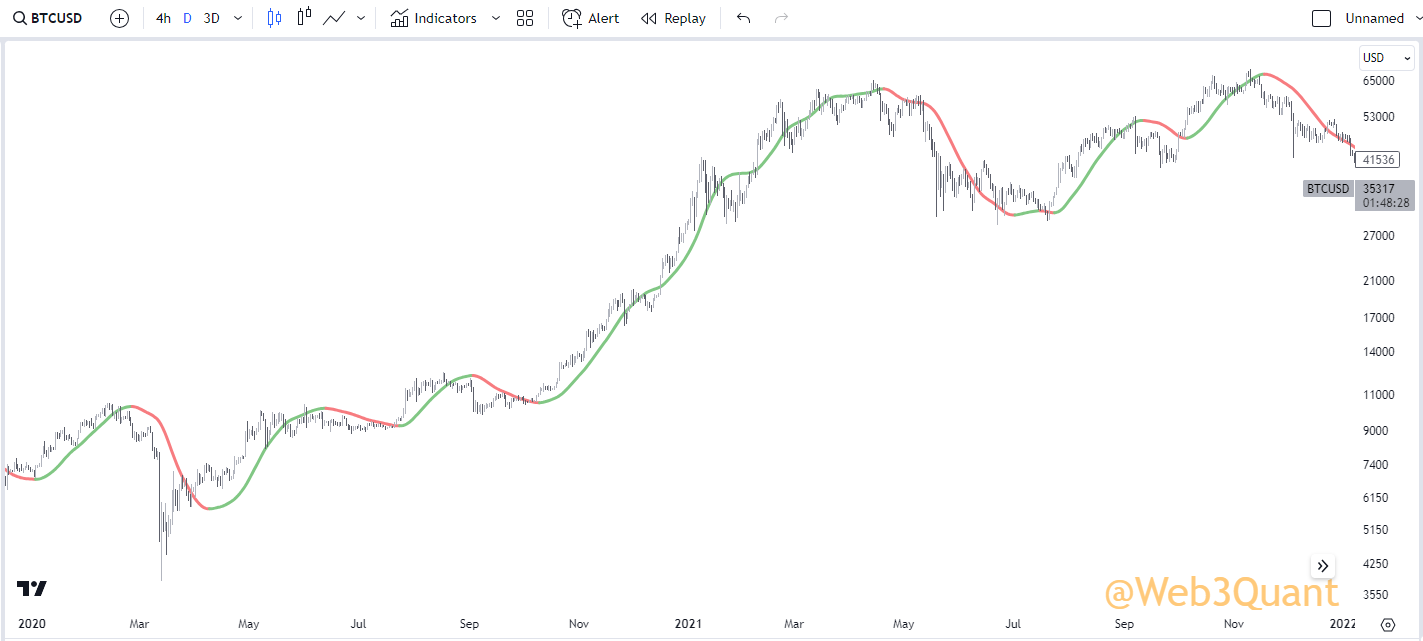
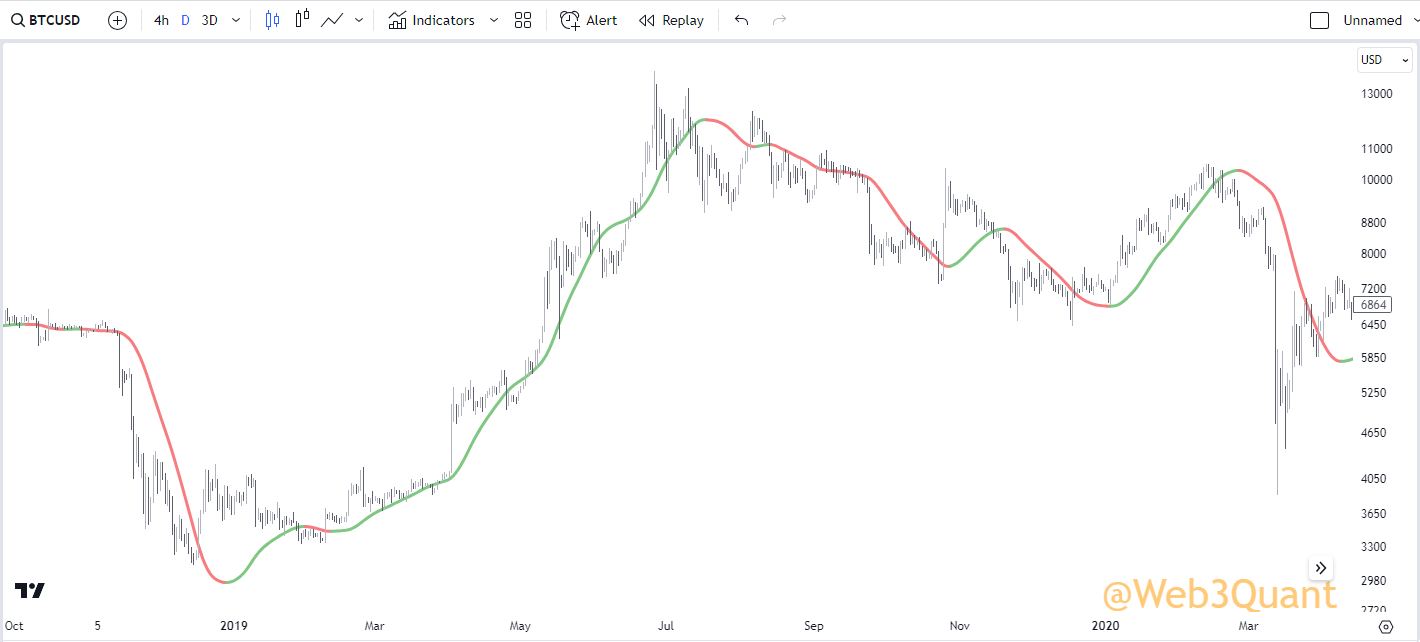
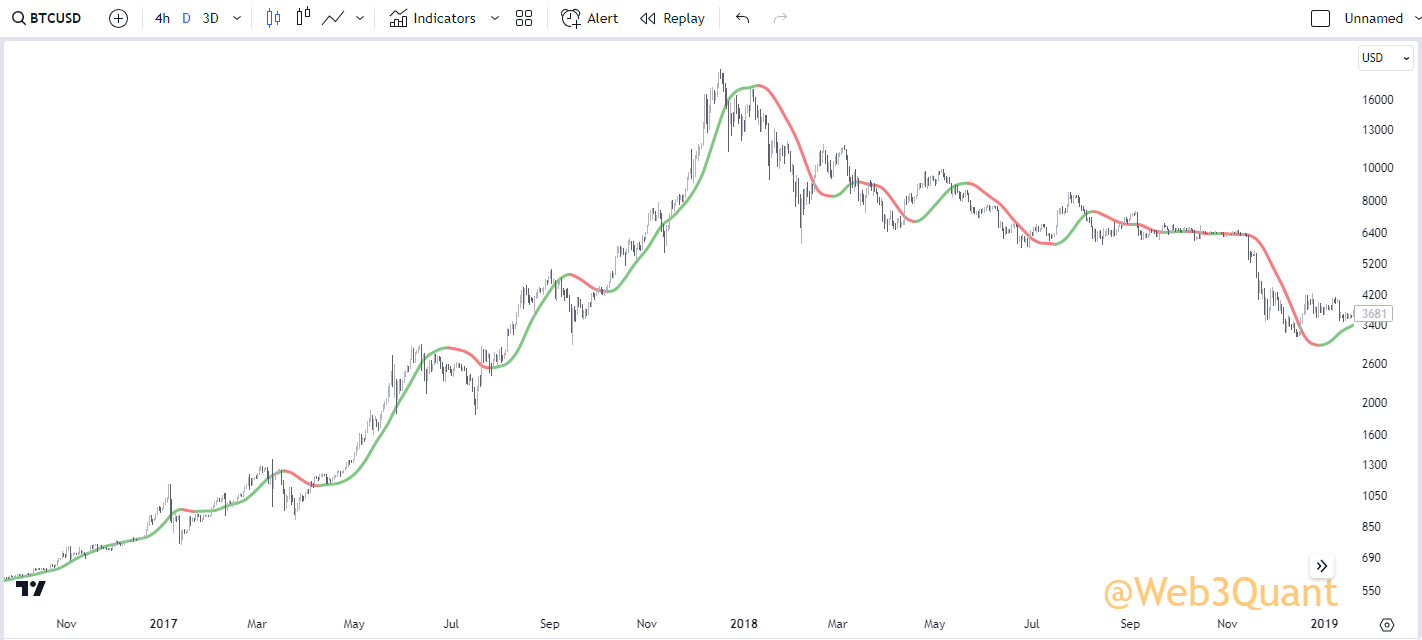
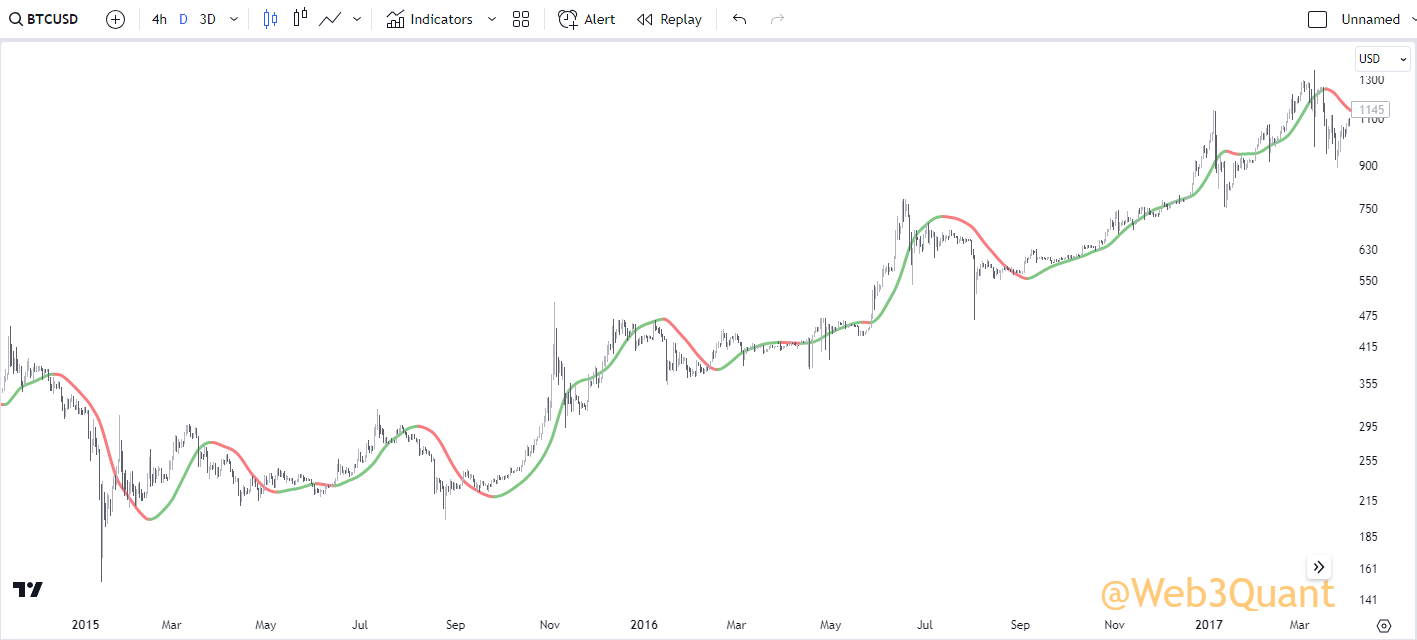
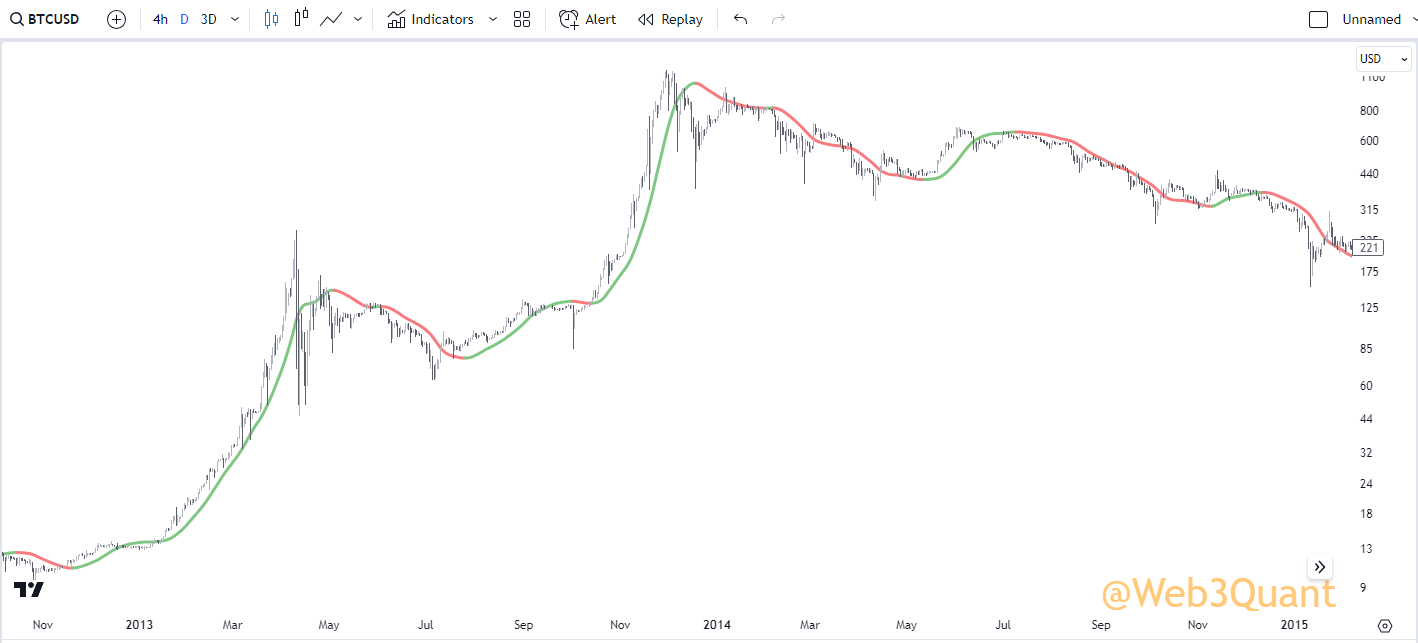
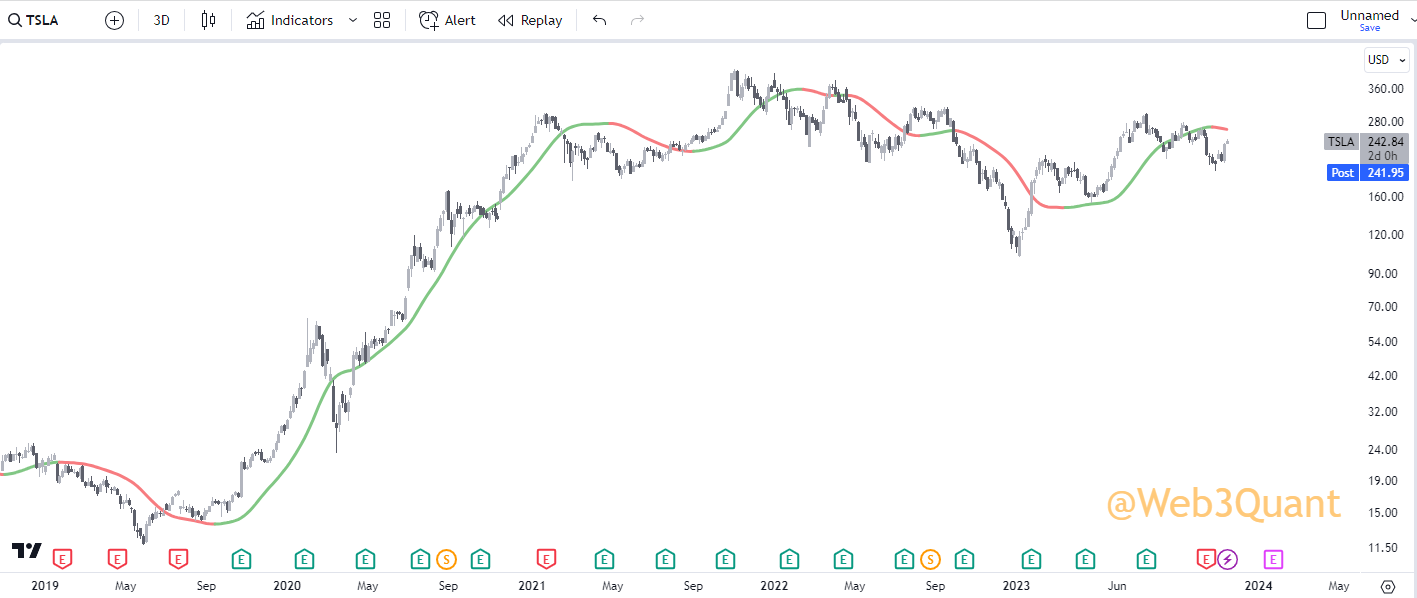
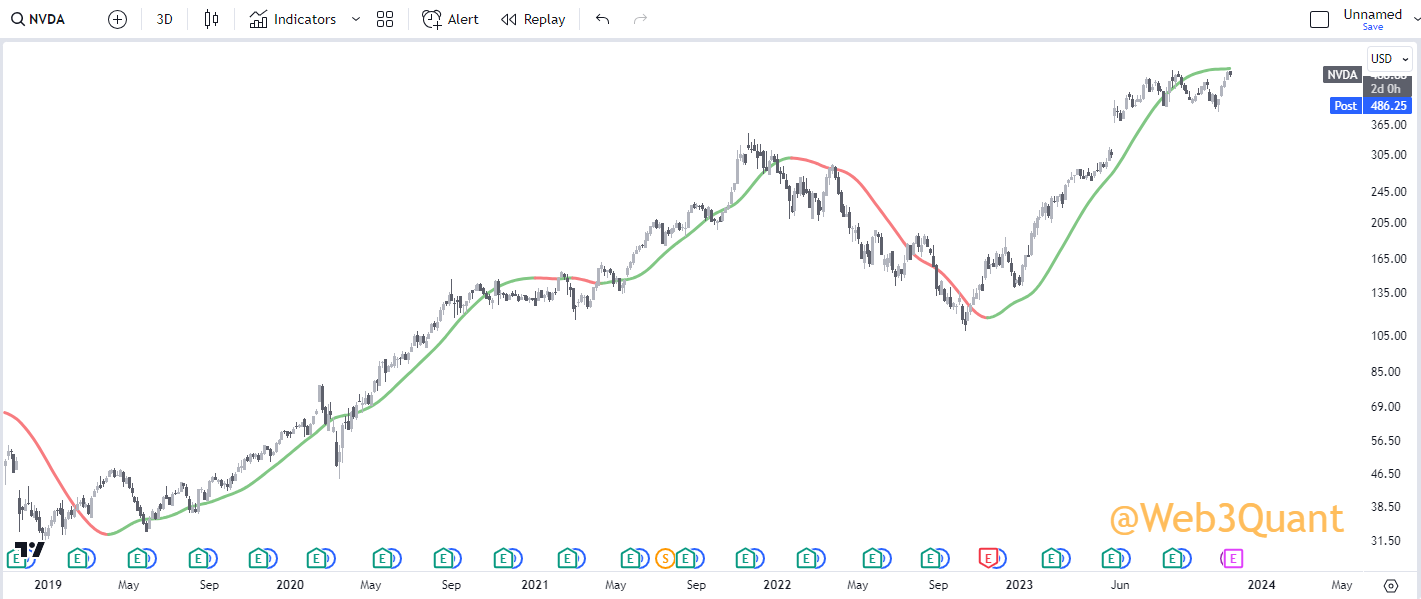
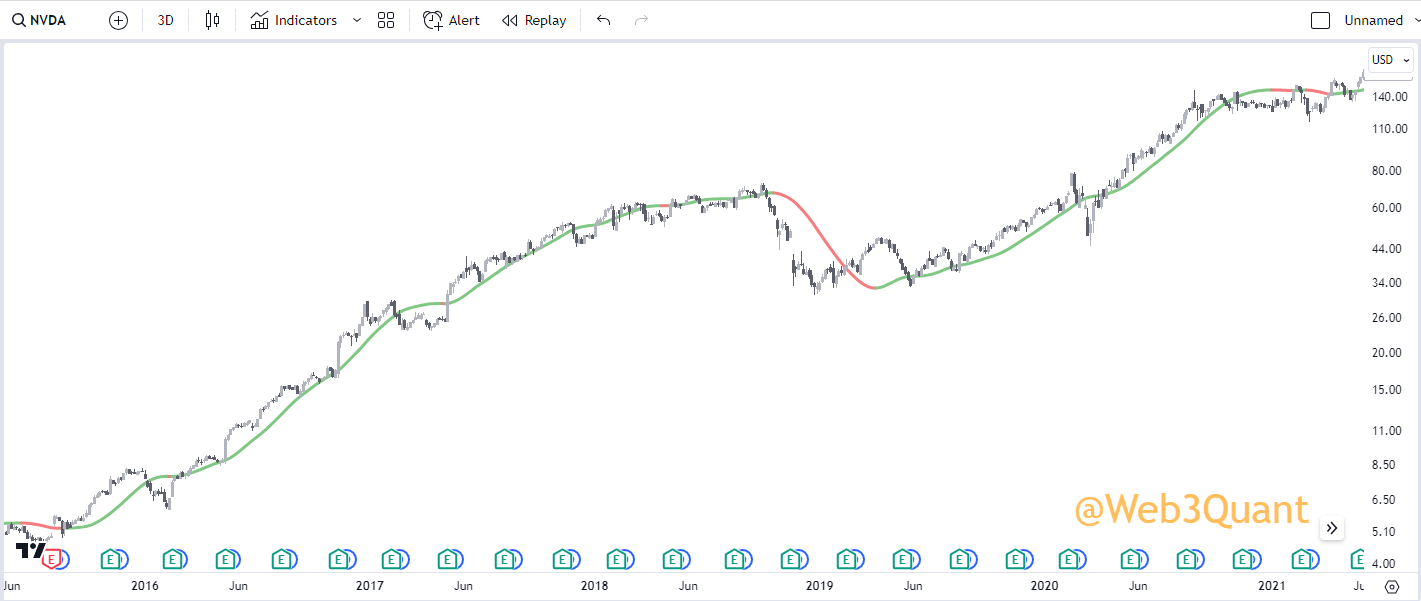
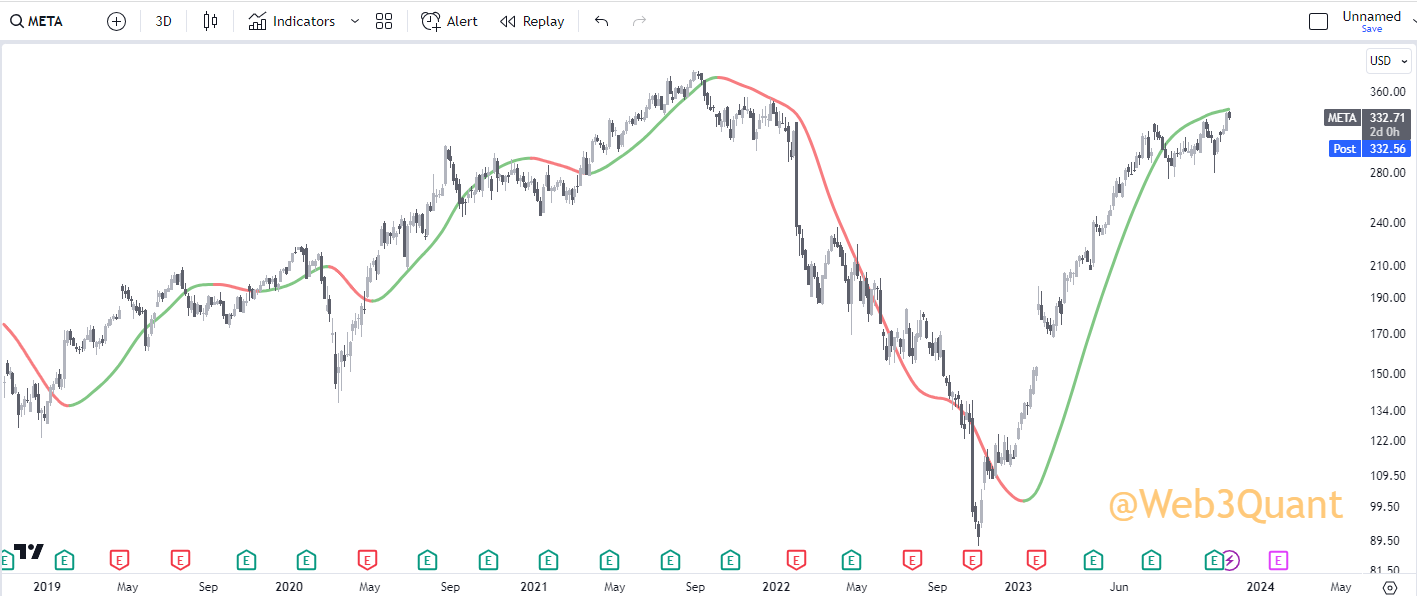
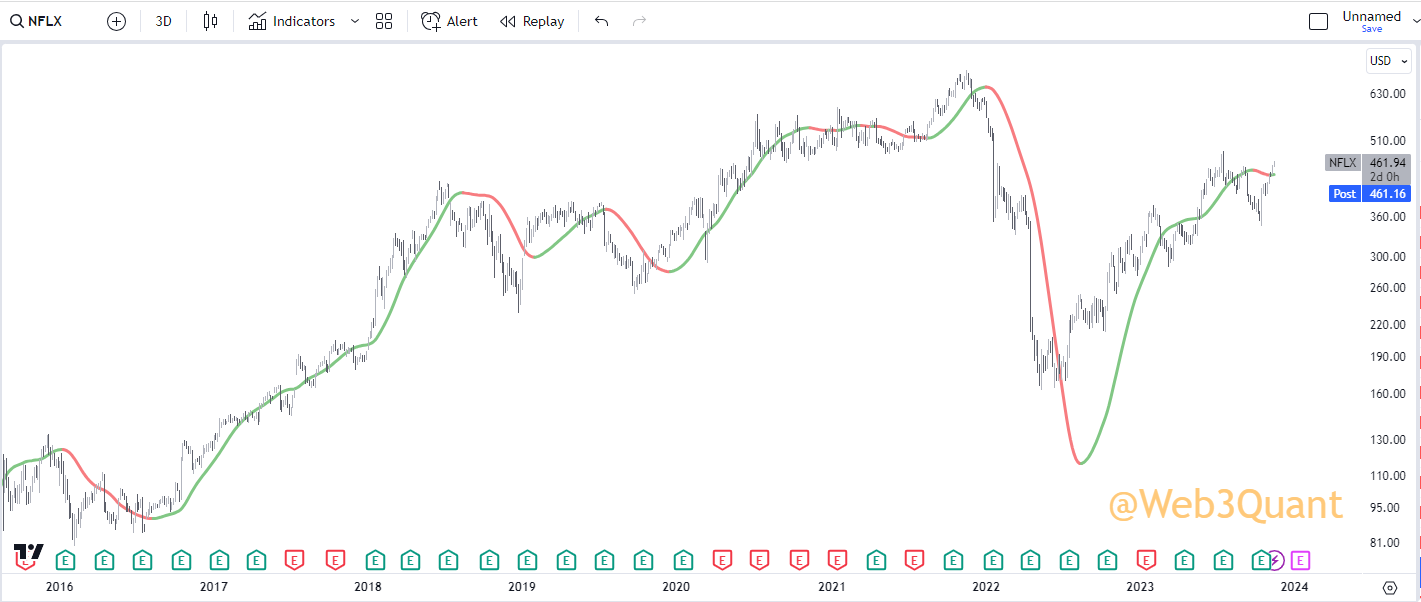
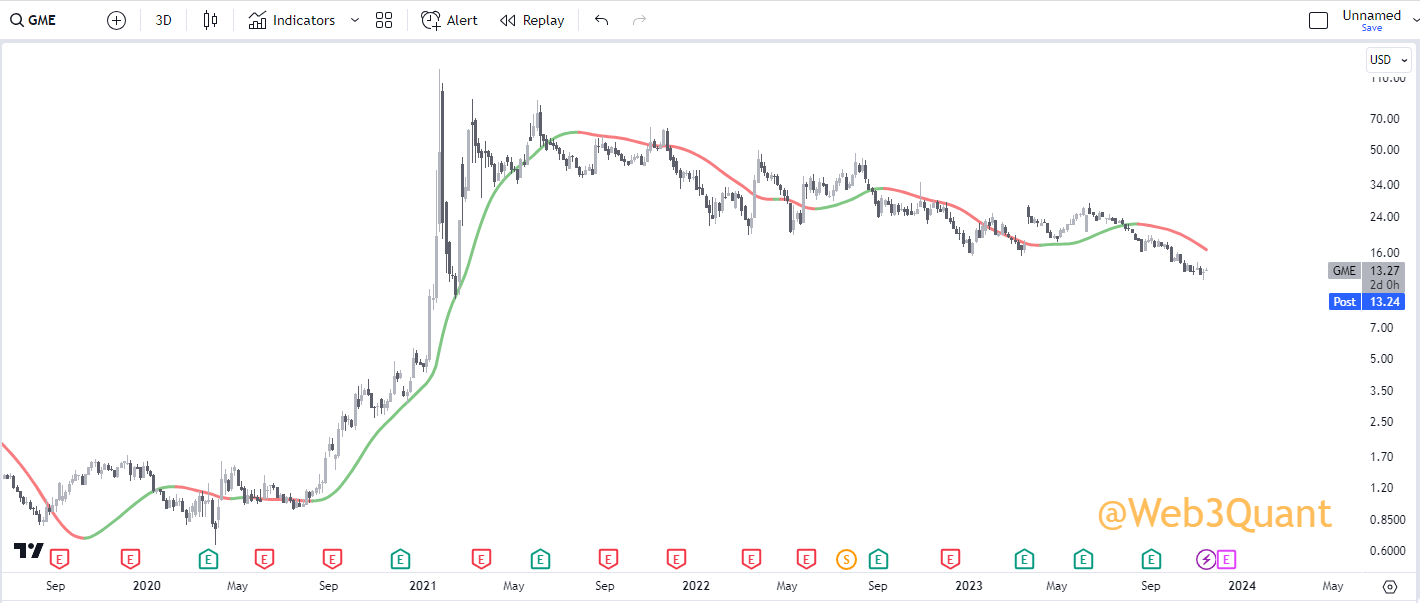
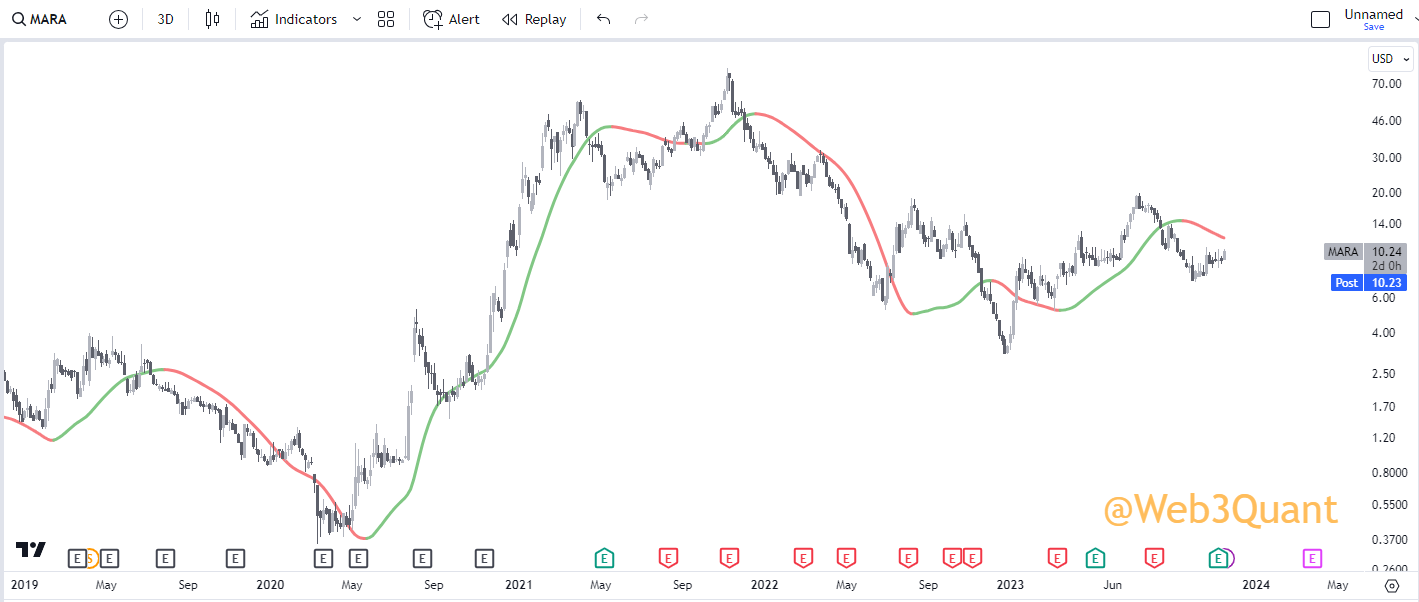
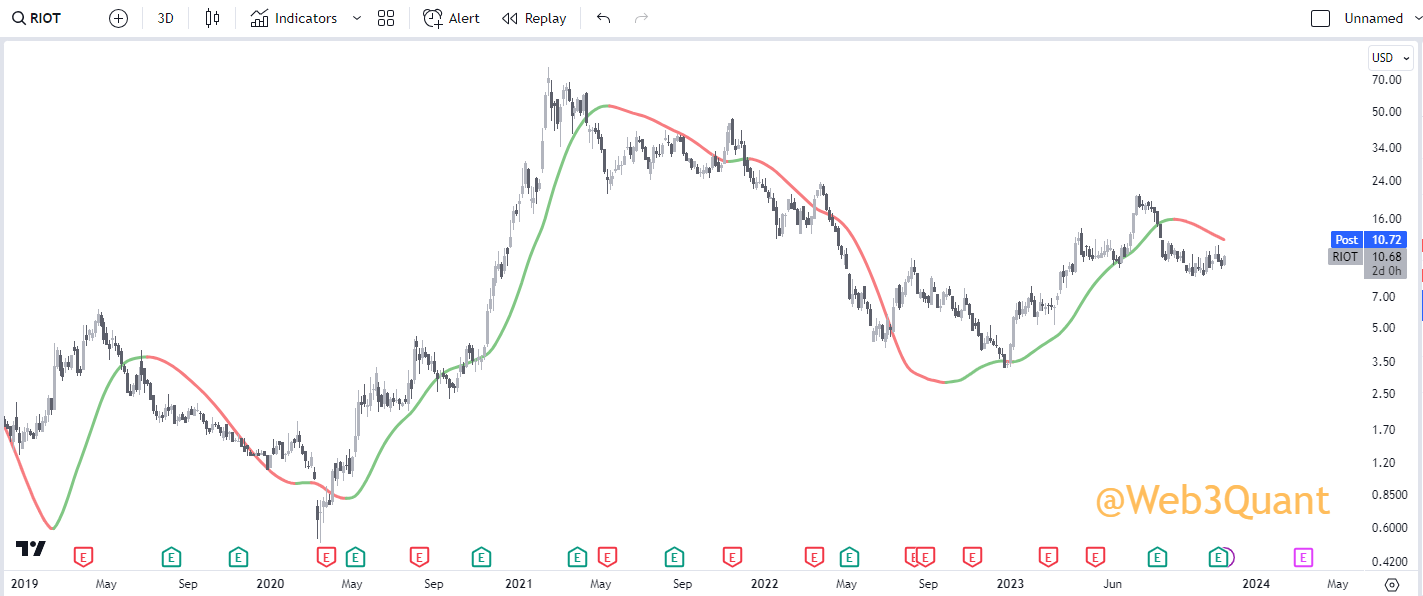
How does the Web3Quant indicator work?
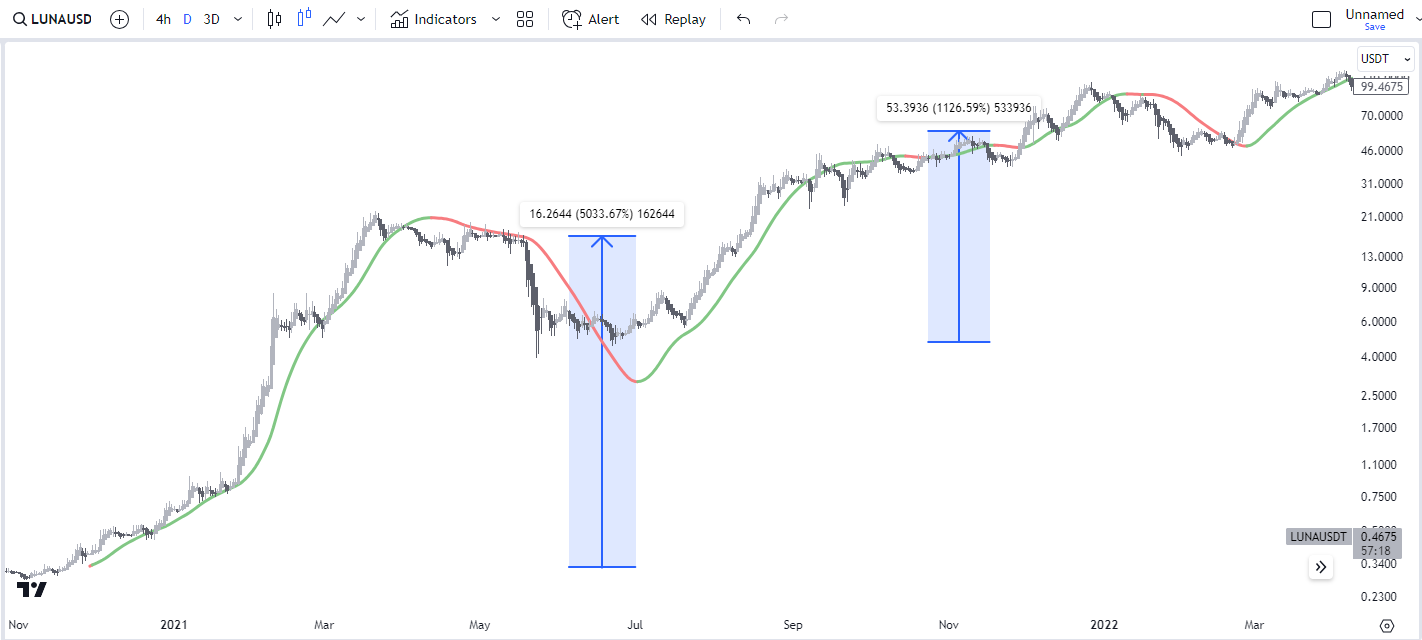
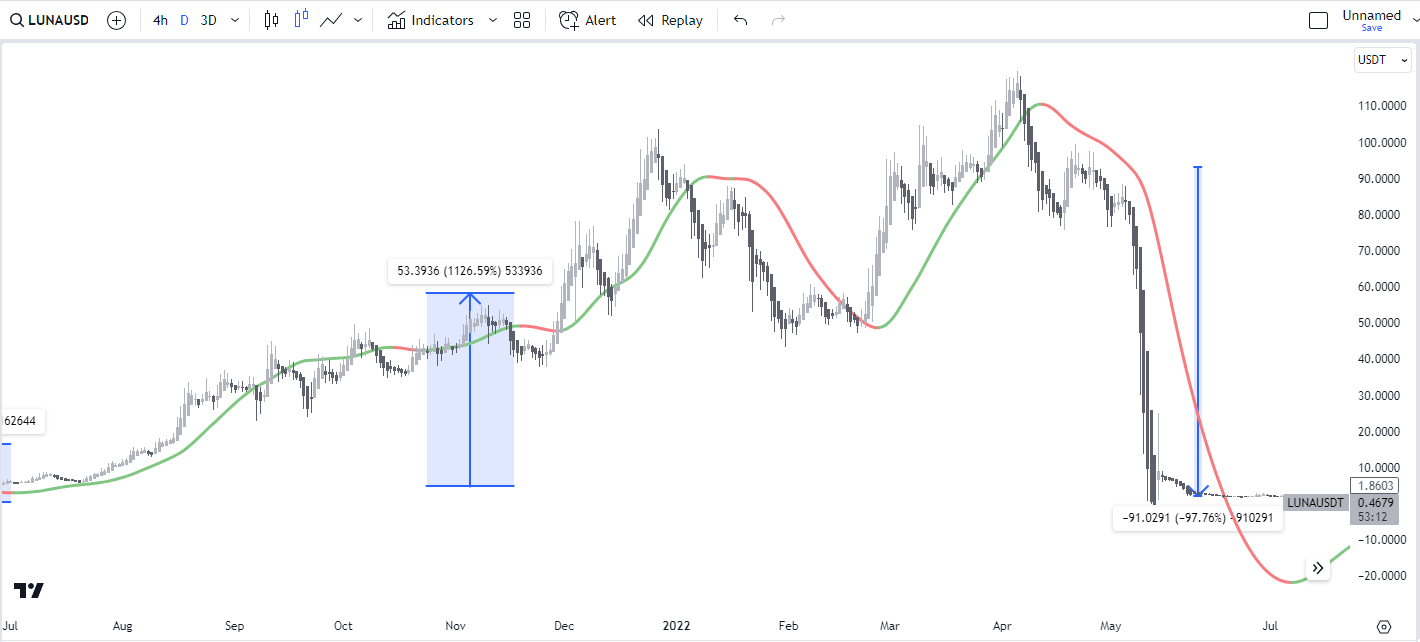
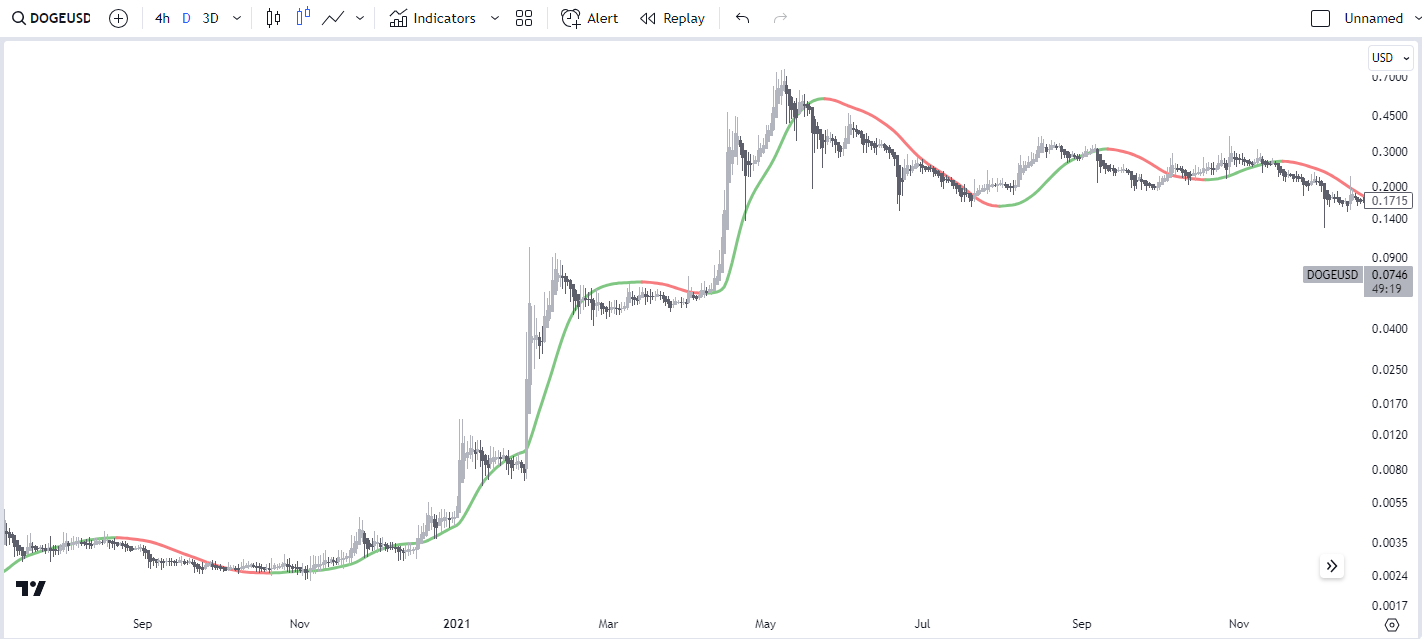
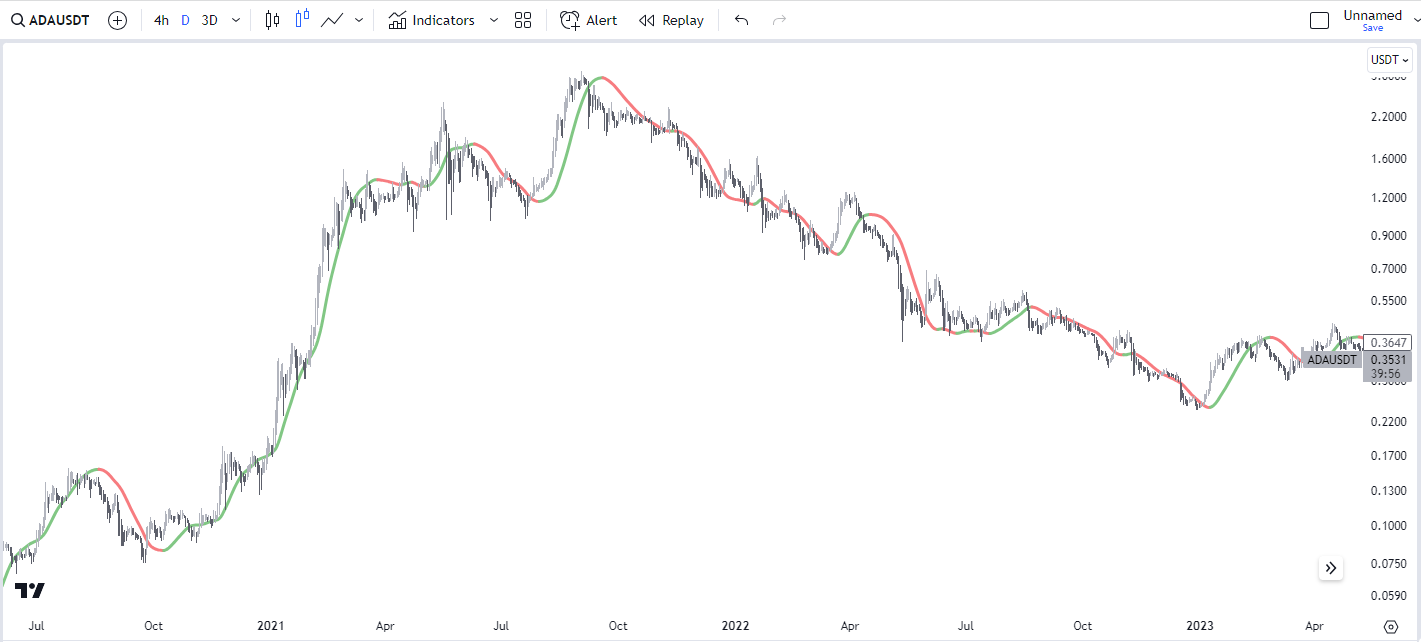
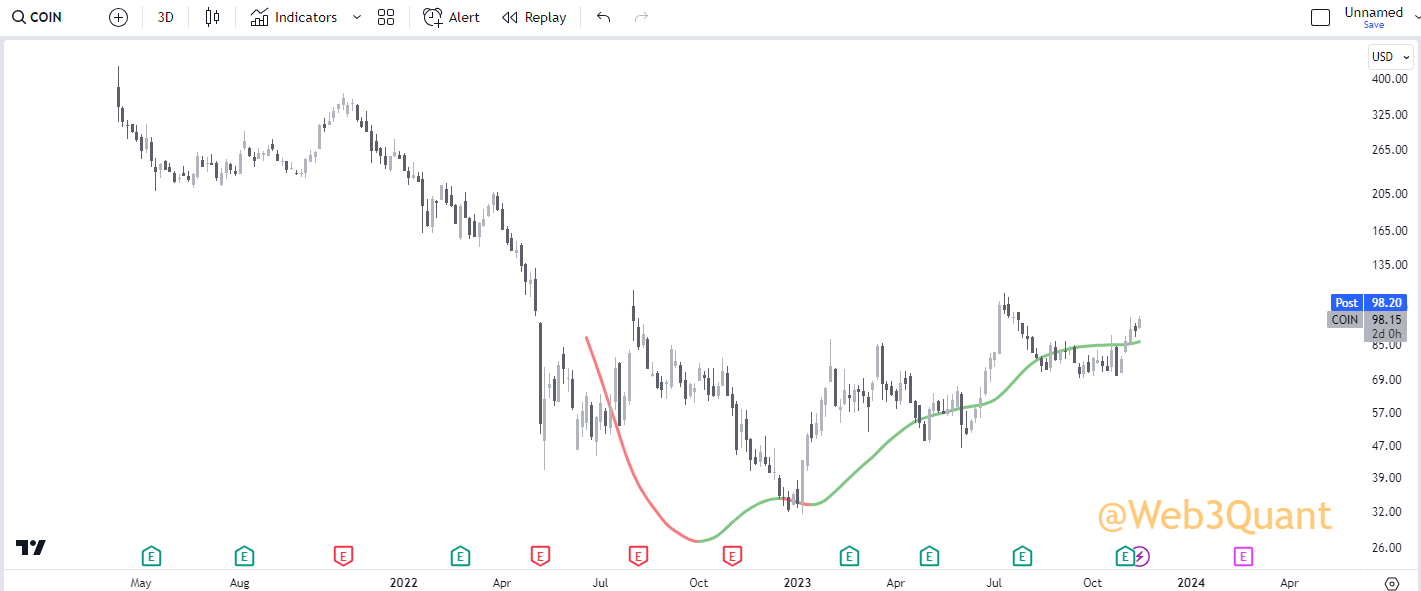
Green indicates a buy; red, a sell. No guesswork.
Those lines also act as support/resistance levels respectively.
What are the best-suited timeframes for the indicator and the use cases for each?
3Day, Daily, 4hour.
3Day - For Investors who operate with a value thesis but need an instant quant-based decision.
For traders, it's a great Bull/Bear regime filter.
A good regime filter alone can save you from a lot of pain. It's no secret that during the bull everyone makes money. even folks who can't spell the word Trading.
But 90% of them cannot keep the money they made. Why?
Coz they don't know when the music has stopped. They keep trading or bag-holding and give everything back during the bear.
Only a few can mentally recover from the pain of round-tripping the bull run gains.
A regime filter will ensure both investors and traders are always on the right side of the trade.
Daily - This will be the universal High Time Frame (HTF).
4-hour - This will be the universal Low Time Frame (LTF).
These are suitable for positional trades. Good enough to ride 50-100x as you will see in the results.
Indicator works on scalping timeframes too but will cover that in a separate post as it's a very different ball game.
Depending on trading style one can only operate on HTF, LTF, or a combination of both.
In the coming days, I will publish a lot of insights on different ways one can use this indicator for
- Building Regime Filters in both Crypto and TradFi.
- Relative Strength for Alt Cross Pairs. Alt/BTC, SOL/ETH, etc
- How to gauge Alt/BTC Season and other Dominance Plays.
- How to play on-chain names that do not have much fundamental info or price history.
- Options trading, Income-generating strategies on VIX, covered call ETFs, etc.
- Psychological aspects and combining indicators with subjective elements around us and many more things that you would like me to cover.
All of this will be more of a value-add than just giving access to the indicator alone IMO.
How is it different from the W3Q model?
Trading is all about answering only 3 questions. Thats it.
WHAT? WHEN? HOW? to buy/sell.
How much aka allocation is very personal to each individual but the
WHAT and WHEN can be standardized. Hence Web3Quant only focuses on those.
What - is solved by a quantitative scanner. It signals what coins to long/short. This is critical as everyone has a finite capital but there are 1000s of new Coins/Stocks.
When - is solved by a signaling indicator.
NOTE: You are NOT getting access to the scanner or the indicator that I use ( that will not be made public). Those insights will only be shared via regular updates.
Instead, this is an indicator developed for the subs specifically.
Also, you can achieve 70% of the results with a simple moving average crossover or a super-trend indicator with smoothed settings.
Most folks who SELL their indicators/trading systems have some form of the above.
Without the curated scanner output and/or some form of insights and updates, they don't add any more value than a simple crossover would IMO.
That is why at W3Q it's not a separate product. Instead, as a value-add to an existing product.
Only someone who tried to develop these models would tell you pain points and that the effort & difficulty go exponentially higher when you try to improve the results from 70% -> 80% -> 90%.
Even a delay of a couple of price candlesticks can make a strategy non-profitable.
That is the reason crossovers/supertrends aren't profitable as a system unless one is a discretionary trader.
Let's get into the results...
To keep this post short we will only cover indicators HTF Signals on Daily Time Frame.
Will go through selective coins to cover the different "categories" of coins.
Rest you play with when you get access to the indicator or we can during AMAs.
BTC should give an idea of the entire space.
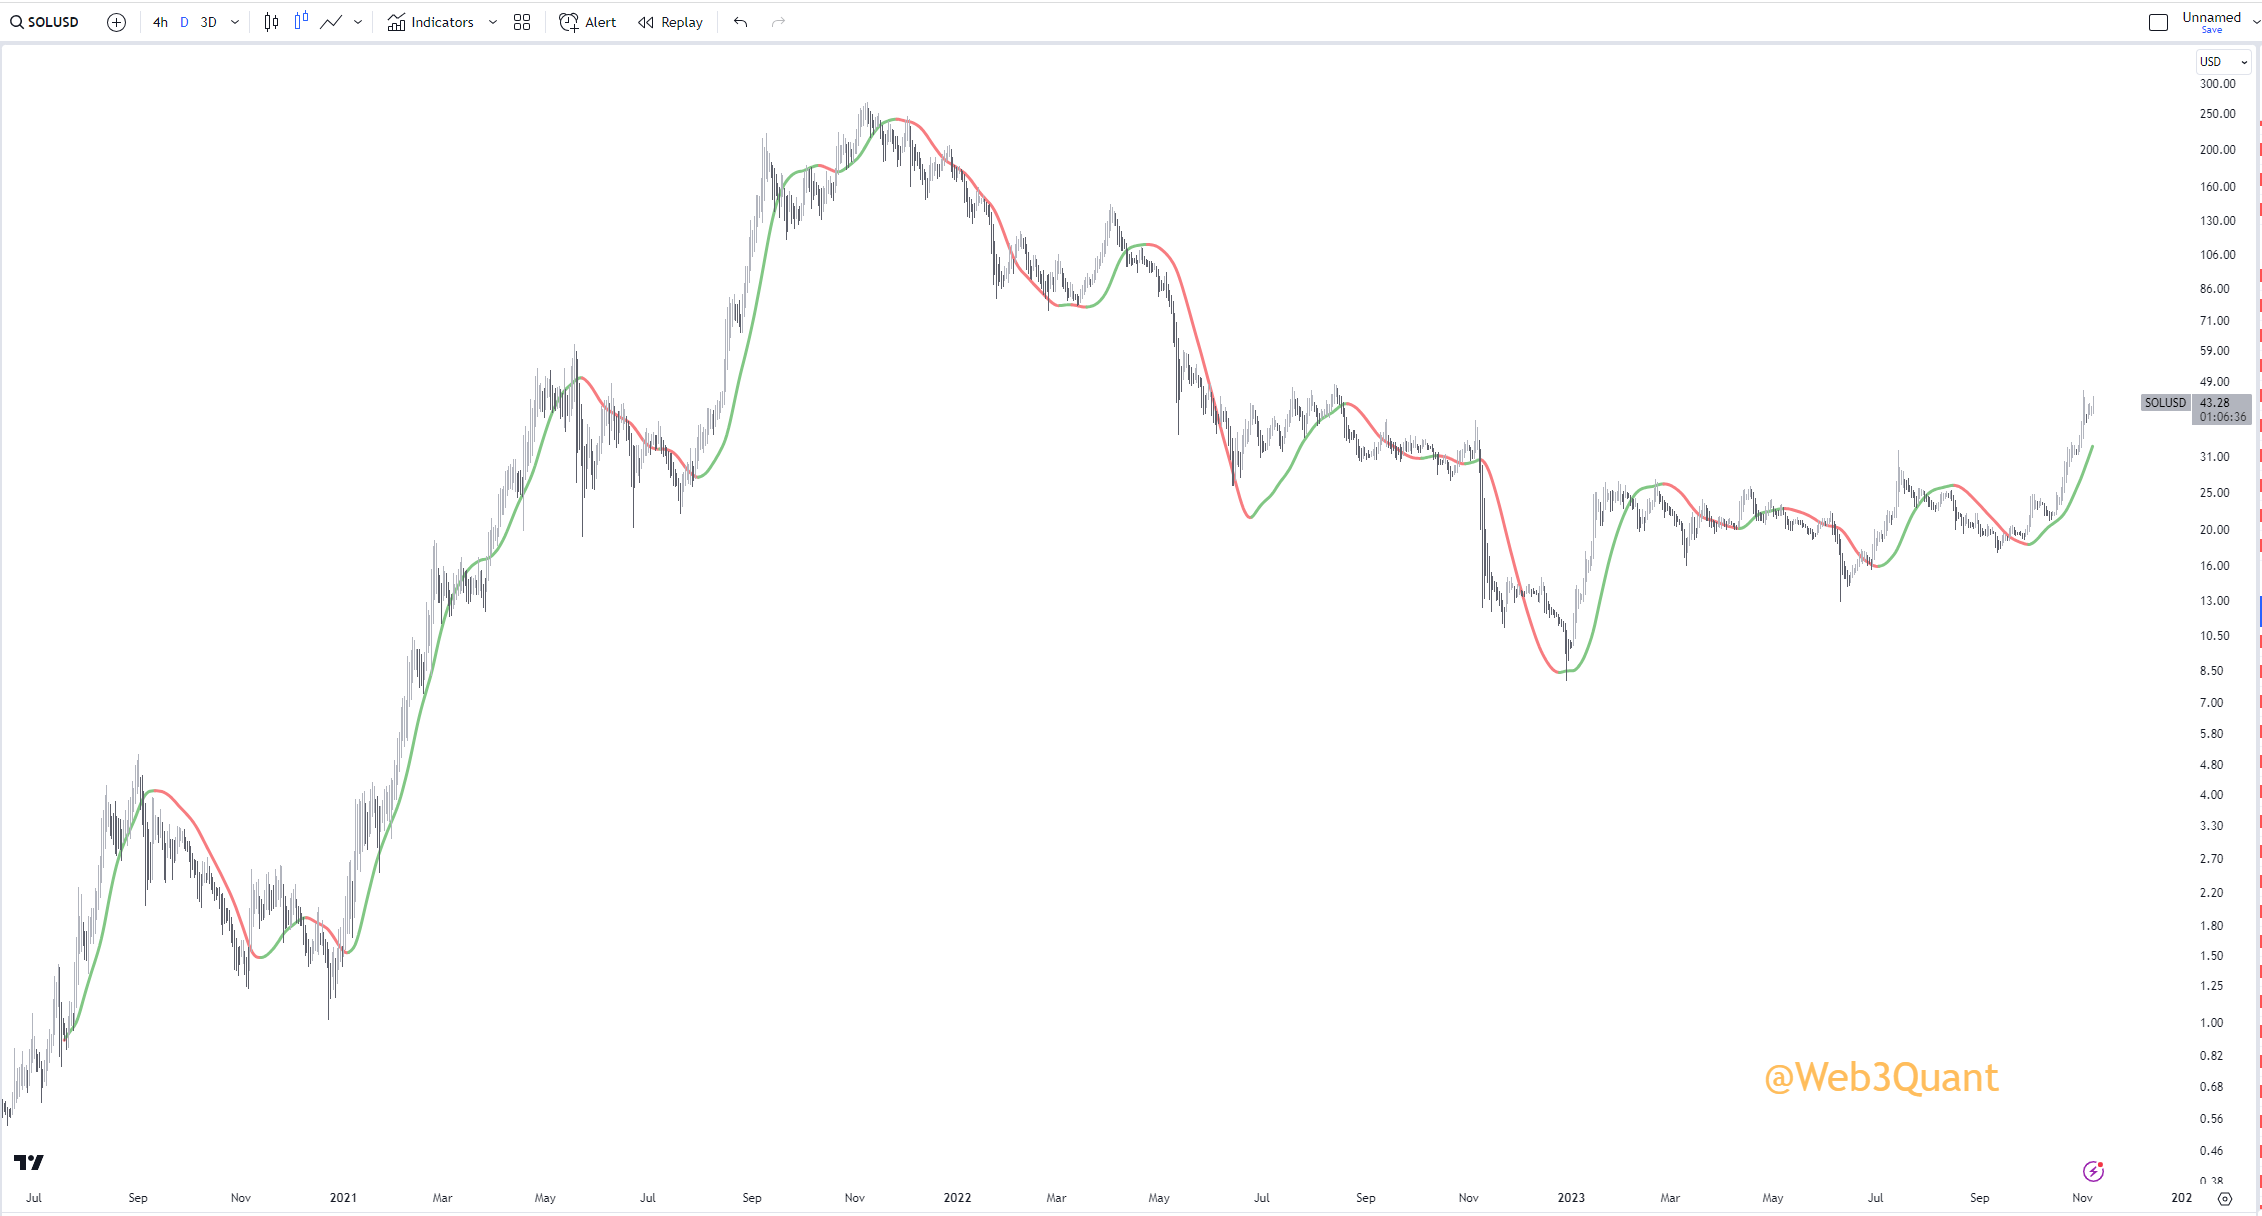
SOL - Extreme winner. Extreme FUD. Most hated coin.
DOGE - OG meme play.
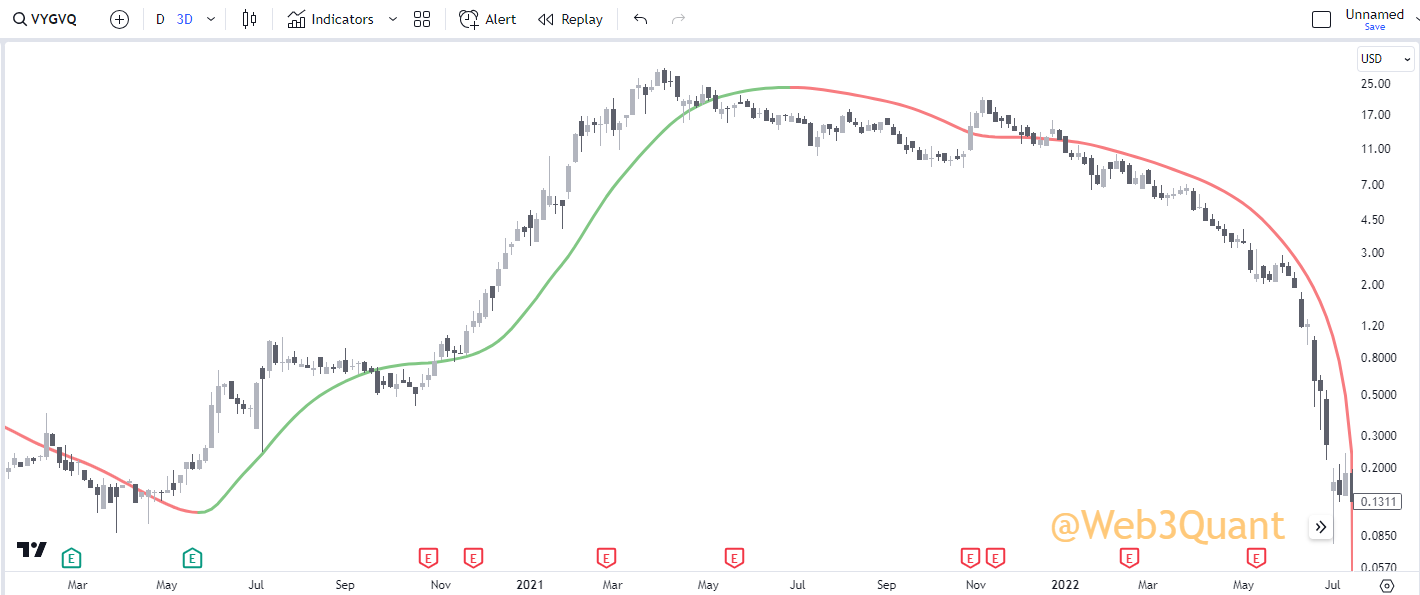
LUNA - Meteoric rise and Fall to Zero.
ADA - Light on fundamentals but heavy on cultish following.
Nothing against others but chose these as they are a lot harder to play with conventional value thesis or due to extreme sentiments/newsflow/noise.
BITCOIN
SOL
LUNA - The Rise
LUNA - The fall
DOGE
ADA
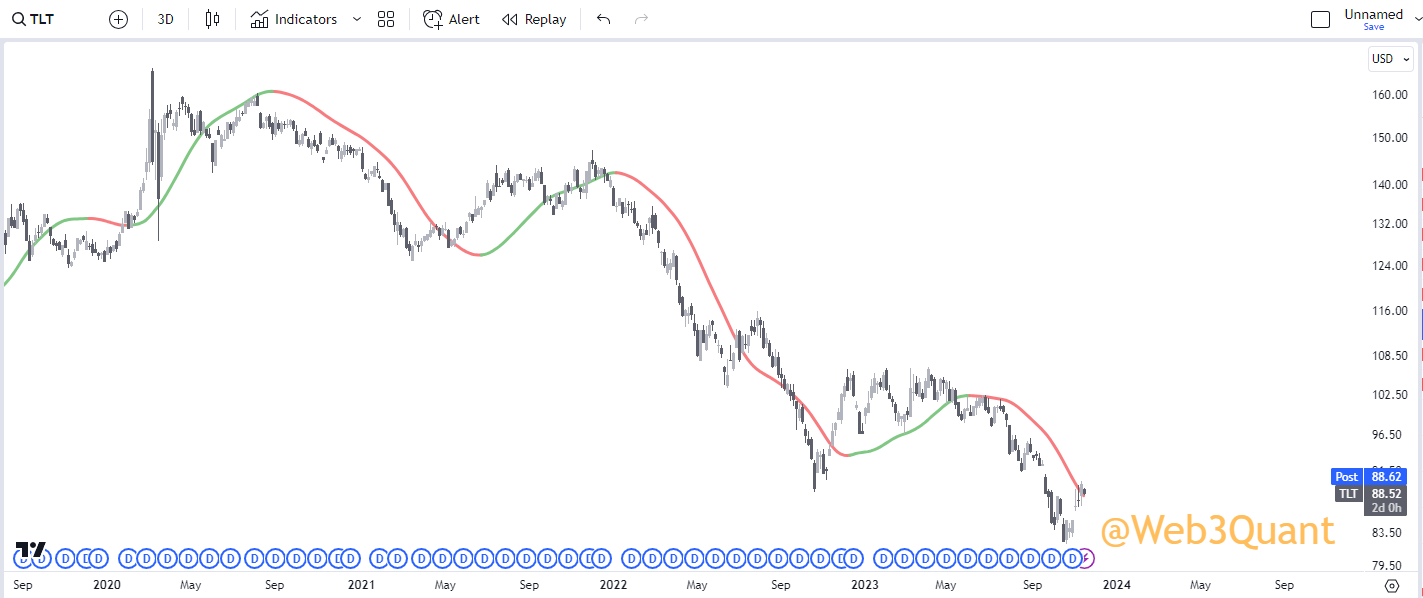
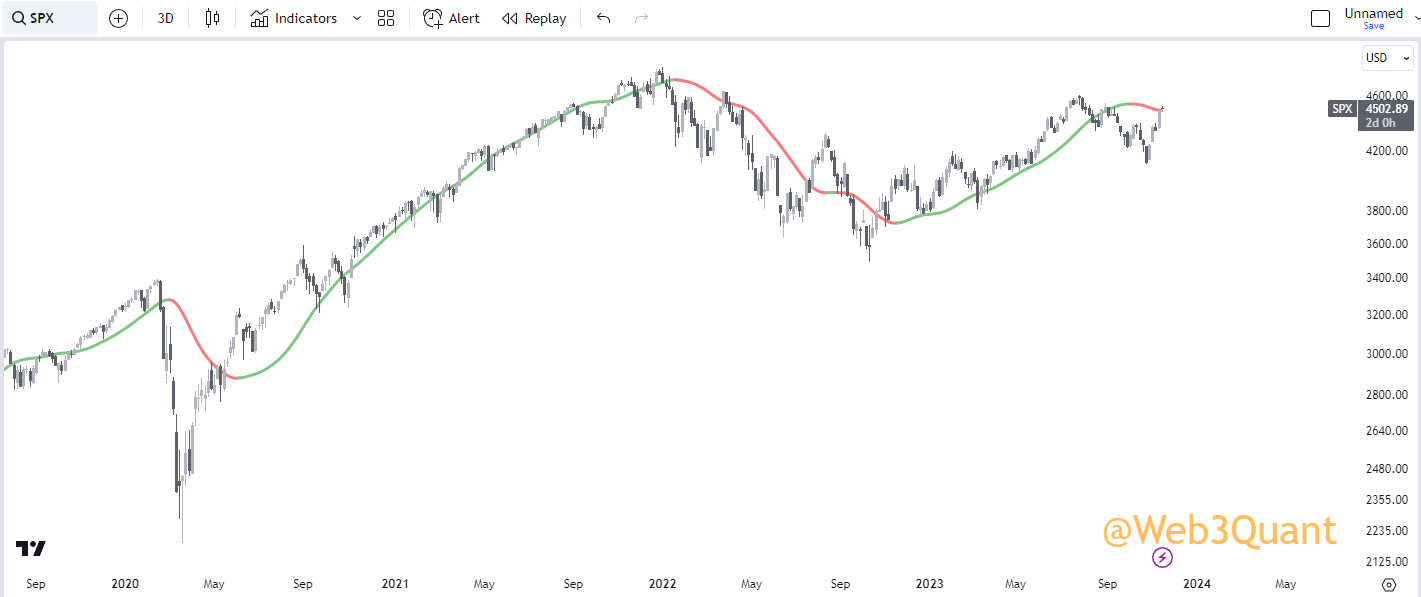
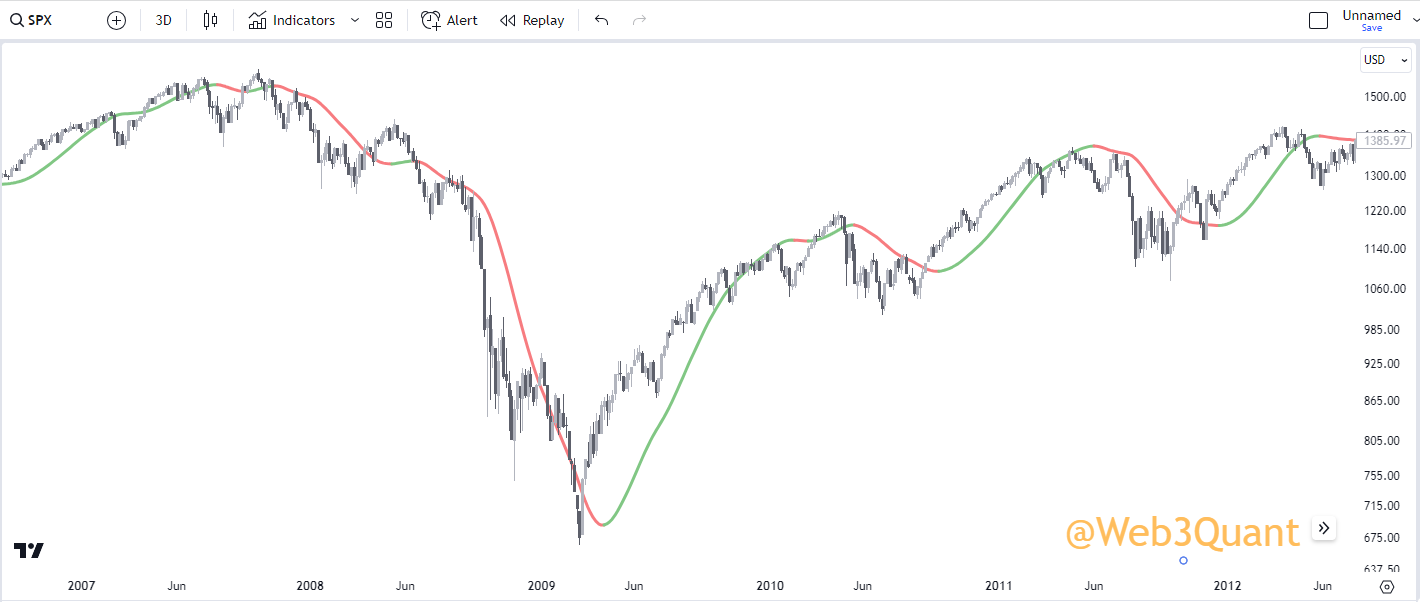
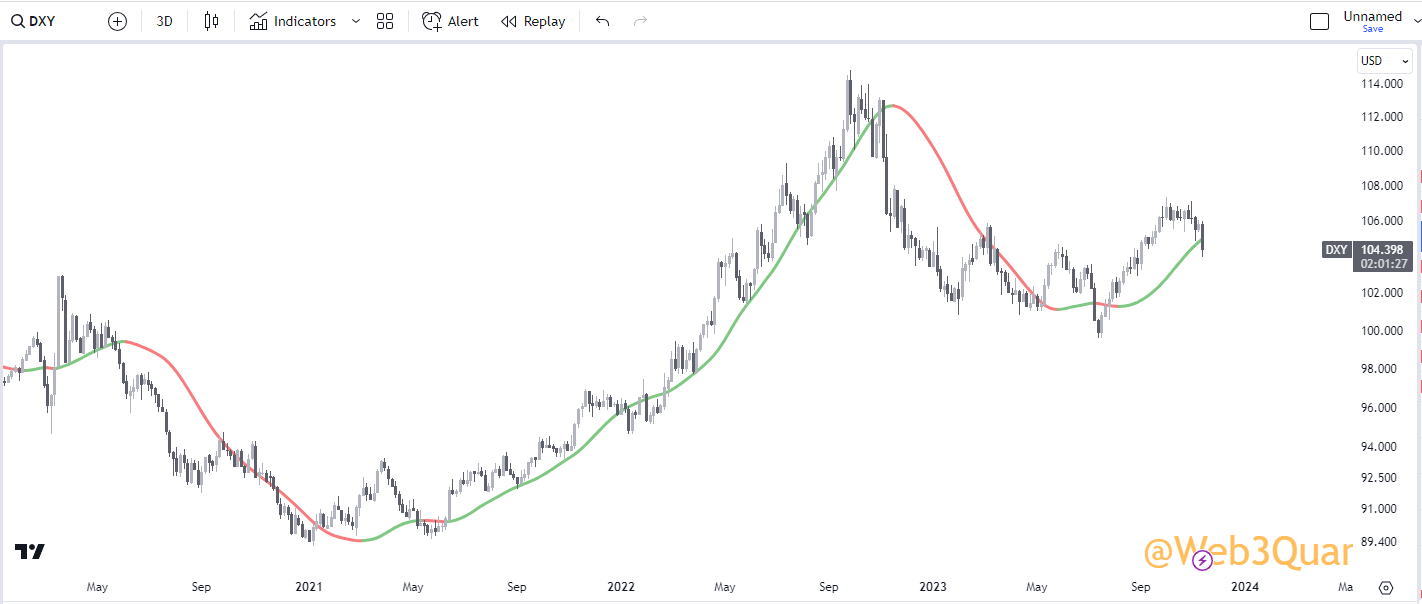
Let's move to the TradFI results. Here we will look at results on a 3Day timeframe to give you a big-picture perspective.
NOTE: This is the exact same indicator you saw in earlier with the same settings. Just run on a 3Day timeframe.
MACRO
It's a fascinating subject to discuss at parties and argue with strangers over the internet till your face turns blue.
The reason many "gurus" get away with saying anything coz it can take years for something to play out and by then no one remembers what you said anyway.
There are only 2 kinds of people.
1- Those who don't know sh*t about macro.
2- Those who don't know that they don't know sh*t about Macro.
The only folks worth following for Macro are those who use some sort of charts/price action to back their thesis and stitch the story. Coz they are more grounded in reality than fiction.
I choose to go a step ahead and only focus on Data and ignore the story coz I have learned the hard way that
Prices precede narratives and not vice versa.
Show me the price, I will tell you the news.
If the chair of the US Federal Reserve cannot reliably predict how hot inflation can run or what would be the interest rates down the line and chooses to be "Data Driven" then so should you.
Here are the ONLY 3 macro variables you will ever need to predict everything.
Bond Market (TLT)
Equities (S&P 500)
Worlds Reserve Currency (USD)
** Web3Quant is not registered with any financial regulatory agencies. Web3Quant content is purely for research, education, and entertainment purposes and should NOT be considered personalized financial advice. Do your own research and consult your financial advisor.**